How to Track Which LinkedIn Posts Bring Paying Customers
Learn how to tag LinkedIn posts, tie visits to sales, and see which posts actually bring paying customers instead of just likes.

NoirTrack team·Follow

The reliable way to track which LinkedIn posts bring paying customers is to tag every LinkedIn post with unique UTM parameters and connect those visits to revenue. With NoirTrack, you can rank posts by revenue, not just clicks, and see which ones produce customers. This does not work well if you reuse the same link everywhere or never record sales.
LinkedIn likes and impressions are easy to see, but they do not tell you which post produced customers. A tagged link gives each post its own source data, and you can match that traffic to purchases or signups.
The fix is simple: give every post its own tagged link, then connect those visits to purchases or signups. When you tie source data to revenue, you can see which posts deserve another round and which ones only attracted attention.
After reading this, you will know how to label LinkedIn posts so you can connect each one to revenue and pick the posts worth repeating.
Why LinkedIn post performance is hard to measure
LinkedIn post performance is hard to measure because engagement data stops before the sale. A post can earn clicks from people who never buy, while the buyer may return later through a saved tab, direct visit, or another session. Native analytics show reactions and visits, but they do not connect a post to revenue in your own system. If you reuse the same URL across multiple posts, the visits blend together and you lose the link between one post and one customer.
The metrics that mislead you
Likes tell you who noticed the post, not who wanted the product. A post with 200 likes can still produce zero trials if the audience fits the topic but not the offer.
Clicks need context too. Some clicks come from curious readers, some from bots, and some from people who leave in five seconds. A click count alone cannot tell you whether the post brought qualified traffic.
Followers are also a weak signal for buying. A founder can build an audience of 10,000 and still get most revenue from 20 repeat visitors who came in from a few posts with strong intent.
What you actually need to know
To measure a post properly, you need to connect the post to the visit, the visit to the goal, and the goal to revenue. NoirTrack reads UTM parameters automatically, so a tagged link like https://yoursite.com/?utm_source=linkedin&utm_medium=social&utm_campaign=q2-launch stays grouped by source and campaign instead of merging into a pile of generic social traffic.
That gives you three answers for each post: which exact post sent the visit, which visits became goals or purchases, and which post earned the most revenue per click. If one post sends 40 clicks and 2 sales worth $300, while another sends 10 clicks and 1 sale worth $250, the second post is the stronger one on revenue per click.
Use one UTM pattern for every LinkedIn post and change only the campaign or content value per post. Consistent tags keep the reporting clean.
You can then compare one post against another inside the Sources panel and revenue reports, instead of guessing from likes or click counts. That is the difference between seeing attention and seeing money.
How do you tag LinkedIn posts so each one is trackable?
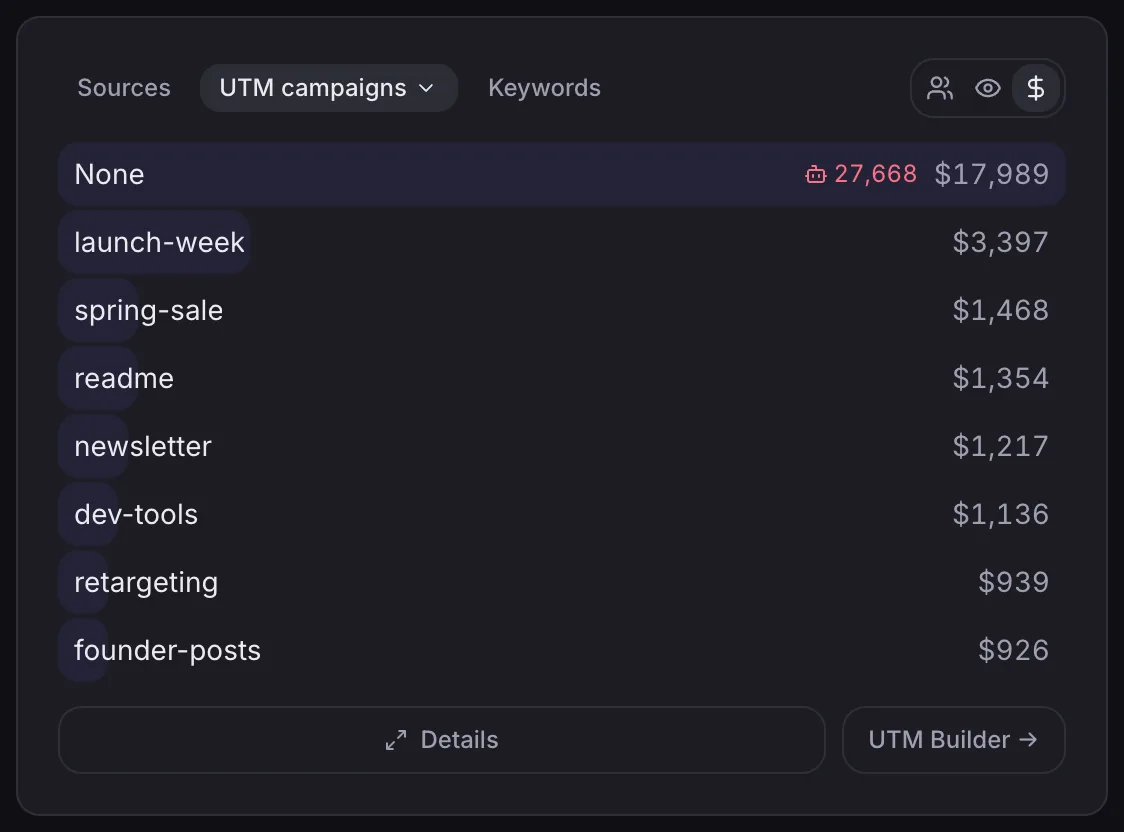
Use one unique UTM link for every LinkedIn post. NoirTrack reads UTM parameters automatically, groups visits by source and campaign, and ranks those campaigns by revenue, so you can see which post sent buyers instead of just clicks. Keep the destination page the same when you compare posts. Change only the post-level tracking values, then check the Sources panel and switch to Campaigns to see the list update. The UTM guide shows the same pattern for shared links and how the campaign view ties into revenue tracking: Campaigns & UTM.
A clean tag set gives each post its own row in Sources. If two posts point to the same landing page, the page stays constant and the campaign field does the separating. That makes the comparison fair because the offer, pricing page, and checkout path do not change.
Set a naming pattern
Use the same source name every time, such as linkedin. That keeps all LinkedIn visits under one source. Change utm_campaign to match the post topic or angle, like product-story, customer-result, or lesson-teardown.
Add utm_content when two posts point to the same page and you want a second label for the format or hook. Use lowercase and hyphens so one campaign does not split into two versions by accident.
A simple pattern looks like this:
https://yoursite.com/pricing?utm_source=linkedin&utm_medium=social&utm_campaign=customer-result&utm_content=carousel
That link tells NoirTrack the visit came from LinkedIn, came through social, and belongs to the customer-result post. The Sources card then groups those visits under the campaign name instead of a bare referrer.
Tag every post separately
Give each post its own tagged link, even if the destination page is the same. One link per post lets NoirTrack separate the campaigns and rank them by revenue.
- Post one: product story. Tag the link with a campaign that matches the story angle, such as
product-story. - Post two: customer result. Use a different campaign name, such as
customer-result, so the post gets its own Source row. - Post three: teardown or lesson. Tag it separately, such as
teardownorlesson, so its revenue does not mix with the other two.
If you later open Sources and see linkedin broken into several campaigns, that is what you want. Each post keeps its own traffic, conversion rate, and revenue record, which is the only way to track which LinkedIn posts bring paying customers.
How do you see which LinkedIn posts brought revenue in NoirTrack?
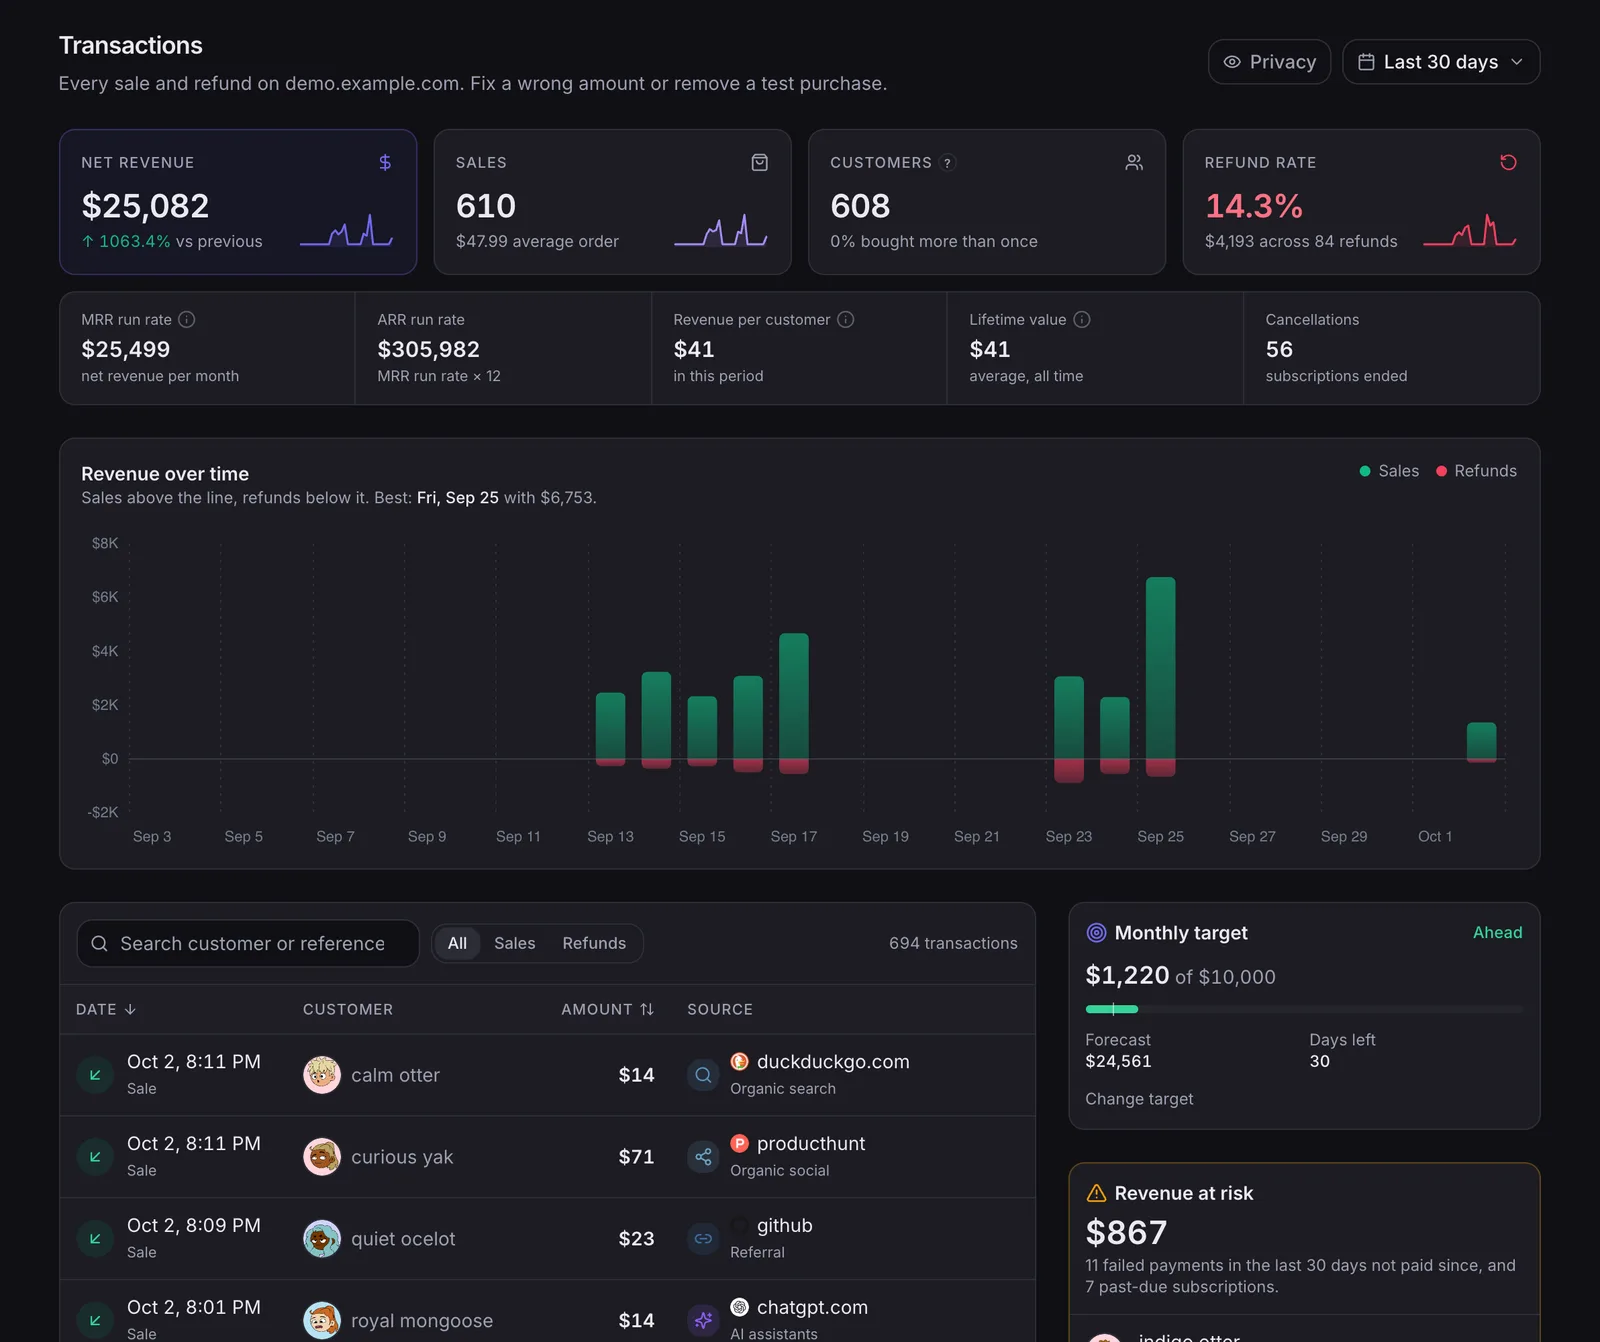
NoirTrack groups each LinkedIn post by its UTM values and matches those visits to sales, so you can see which post brought revenue instead of just clicks. The Sources panel shows the campaign totals, and the Transactions page lets you open a sale and check the source tied to it. That is the clean way to track which LinkedIn posts bring paying customers.
Read the Sources panel
The Sources panel shows your LinkedIn campaigns with revenue next to visits, so you can sort by money and not guess from likes or traffic. Start with utm_source=linkedin and give each post its own utm_campaign, such as launch-thread or case-study-1, so the dashboard groups them separately.
A simple shared link can look like this:
https://yoursite.com/pricing?utm_source=linkedin&utm_medium=social&utm_campaign=launch-thread
Once the visits land, compare revenue against visits. A post with 40 visits and 2 sales can beat one with 200 visits and no sales. That gap tells you which post brought buyers, not just readers. If you want to isolate one post while you review it, use filters on the campaign value and read the full dashboard for that slice.
The chart also helps you spot timing. If revenue jumps after a specific post goes live, you can check whether the spike lines up with that campaign or with another source that same day.
Check the Transactions page
The Transactions page gives you the sale record behind the total, so you can verify the source on a real order. Open a transaction and inspect its source and campaign fields, then match them to the LinkedIn post you shared.
Use this when you need proof for a launch review, a client report, or a post that drove a small number of high-value orders. A dashboard total tells you that money came in. A transaction record tells you which sale came from which campaign.
If a sale looks wrong, compare the campaign name on the order with the UTM tag on the post link. The names should match exactly, including lowercase and hyphens. If they do not, the visit may have been grouped under a different campaign, which makes the total harder to trust.
When you combine the Sources panel with the sale record, you get two views of the same traffic. One shows the rank order across posts. The other shows the individual order that proves it.
Which metrics should you compare for each LinkedIn post?
Compare clicks, goals, and revenue for each LinkedIn post, then rank the post by the money it brought back. Clicks tell you who noticed the post, goals tell you who took a next step, and revenue tells you whether the post paid for the time you spent writing it. NoirTrack keeps sources, goals, and revenue in the same view, so you can check one post without stitching reports together. If you want the mechanics behind the tracking, tag the post link with UTM parameters and connect revenue tracking so every visit and sale lands in the same report.
| Signal | What it tells you | What it misses |
|---|---|---|
| Clicks | Interest in the post | Whether visitors did anything useful after landing |
| Goals | Intent to buy, sign up, or request a demo | Whether those actions turned into sales |
| Revenue | Business value from the post | The top-of-funnel volume that led to it |
A short example makes the tradeoff clear. If Post A gets 180 clicks, 12 goal completions, and $900 in revenue, while Post B gets 420 clicks, 8 goal completions, and $1,300 in revenue, Post B did more for the business even though it got fewer goals per click. The right comparison is money per post, not attention per post.
Compare the right signals
Clicks show interest, goals show intent, and revenue shows whether the post produced a return. Use all three together because a post can attract a lot of readers and still fail to move anyone toward a purchase, or it can send fewer visitors who convert at a higher rate. If you already tag links with UTMs, the Sources panel can group those visits by campaign, and the revenue column shows which post brought sales. See how tracking parameters work for the link format and how revenue attribution works for the sale matching.
Use a small scorecard
Use a scorecard with four fields: post title, visits and goals, revenue per post, and a simple yes or no on whether it earned back the effort. Keep the scorecard small enough that you can fill it in every week without touching a spreadsheet for an hour. A tight scorecard gives you one clean place to compare posts side by side.
- Write the post title. Use the exact headline or first line so you can match the report to the post later.
- Record visits and goals. Put the click count next to the goal count so you can see where interest stopped.
- Add revenue per post. Copy the sales total tied to that source or campaign.
- Mark the winner. Keep the post if revenue beats the time cost, or rewrite the angle if it does not.
What is the fastest weekly workflow to find winning LinkedIn posts?
The fastest weekly workflow is to publish one LinkedIn post with a unique UTM link, then check visits, goals, and sales after a few days. If you want to track which LinkedIn posts bring paying customers, tie each post to one campaign value and read the revenue beside it.
A repeatable weekly process
Pick one offer. Publish one tracked post. Review revenue by campaign in the Sources panel and, if you record purchases or signups, check the matching revenue report or goal. Keep the angle that paid and rewrite the post that only drew clicks.
When this method breaks down
If the link is not tagged, every post blends together. If you do not record purchases or goals, you only see attention. If you reuse the same link everywhere, one post can borrow credit from another. Tag the next post before you publish it.
Questions, answered.
The best way to track LinkedIn posts that bring customers is to use a unique UTM link for each post and connect those visits to goals or revenue. That setup shows which post led to a visit, then which visit led to a signup, demo request, or purchase. Without separate tags, every post blends into the same traffic source and you lose the link between the post and the sale.
LinkedIn post tracking usually takes just a few minutes per post. You create a tagged link, publish the post, then check your analytics for revenue or conversions from that link. Once the link format is set, the work stays small and the payoff is clear because each post carries its own source data.
LinkedIn analytics show engagement, while revenue attribution shows which post led to visits, conversions, and sales on your own site and payment flow. Likes, comments, and impressions tell you what got attention. Attribution tells you what brought customers, which is the number that matters when you want to spend time on posts that produce revenue.
The most common mistake when tracking LinkedIn posts is using the same untagged link everywhere. That choice merges all post traffic together, so you cannot tell which post won. Unique tags solve that by separating each post's traffic before it reaches your analytics, which lets you see the post that actually paid.
Try NoirTrack
See which traffic actually pays.
Analytics with revenue attribution and a built-in bot firewall. One script tag, live in two minutes.
Free 14-day trial, no credit card
Written by NoirTrack team
The privacy-first Google Analytics alternative with a built-in bot firewall and revenue attribution. See which traffic makes you money, no cookie banner.


